
Flight disruption statistics, September 2026
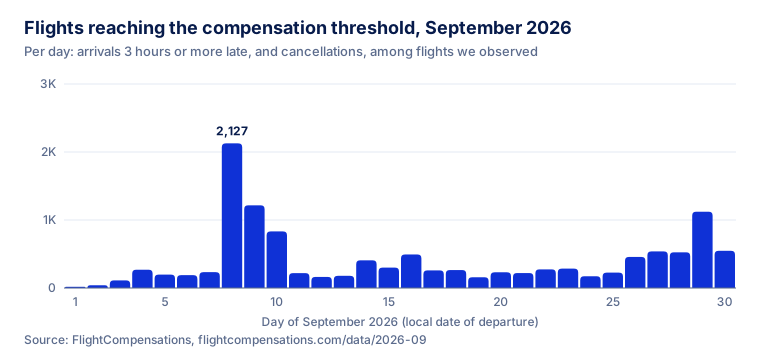
Tuesday 8 September 2026 was the worst day of the month: 2,127 flights reached the compensation threshold, 5.2 times the daily average.
Released 2026-10-02 · corrected 2026-11-02 · CSV · JSON · Markdown · Press: support@flightcompensations.com
In September 2026 we observed 765,291 passenger flights through 160 monitored airports. 12,273 of them (1.6%) reached the compensation threshold: a verified arrival three hours or more late, or a cancellation. Passengers on them could have been owed up to €766.8M. These flight disruption statistics come from our own monitoring.
What stood out in September 2026?
- Tuesday 8 September 2026 was the worst day: 2,127 flights reached the threshold, 5.2 times the daily average.
- The share of flights that reached the threshold fell from 1.8% in August 2026 to 1.6%.
- That day EUROCONTROL recorded the most arrival delay at London Stansted (STN): 7,057 minutes, mostly for ATC equipment.
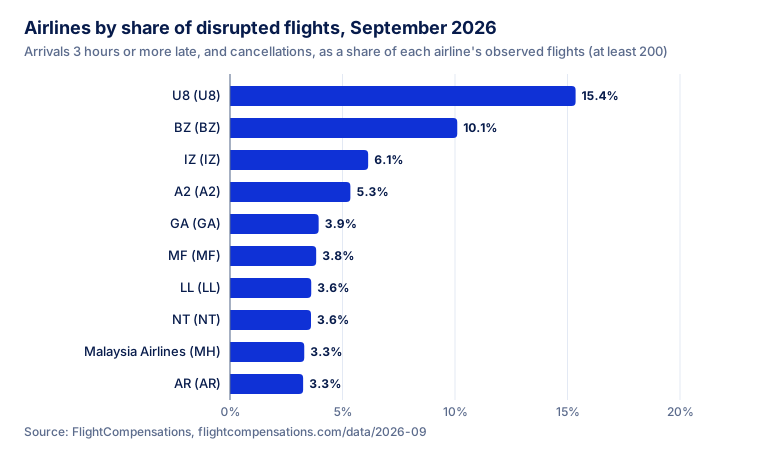
- Among airlines with at least 500 observed flights, BZ had the highest rate: 10.1%, or 83 of 822 flights.
- AEZ had the lowest: 0.0% of 939 flights.
- easyJet moved the most on the month before: from 4.0% to 2.4%.
- Catania (CTA) was the most disrupted large departure airport: 17.8% of 3,192 departures.
- The worst route with at least 30 flights was CTA to ORY: 16 of 37 flights reached the threshold.
- Cancellations made up 77.2% of the disruptions; the rest were arrivals three hours or more late.
- Passengers on these flights could have been owed up to €766.8M under the law, if every seat was full and every claim valid.
What can the September 2026 figures tell you, and what can they not?
Read these limits before quoting a number.
- A sample, not the market. We watch 160 airports, so every count is a floor on what happened in Europe.
- Qualifying is not owed. The airline can still show extraordinary circumstances, such as a storm or an air traffic control restriction.
- The money is a ceiling. It assumes every seat was full and every passenger eligible. We do not know what airlines actually paid.
- One aircraft, one flight. A codeshare sold under several flight numbers counts once, under the airline that operates it.
- Local dates. A flight belongs to the month of its scheduled departure, in local time at the origin.
How many flights were disrupted in September 2026?
The flight delay statistics and the cancellation statistics are counted separately, because the law treats them differently. A delay qualifies from three hours at arrival. A cancellation qualifies on the day the airline files it; the notice it gave decides each claim later.
- Flights observed: 765,291, through 160 monitored airports.
- Qualifying disruptions: 12,273 (1.6% of flights observed).
- Cancellations: 9,471.
- Arrivals three hours or more late: 2,802.
- Compensation passengers could have been owed: up to €766.8M.
- In August 2026: 540 of 29,984 flights (1.8%).
Which airline delay rates were highest in September 2026?
Carriers ranked by the share of their observed flights that qualified. A carrier needs 200 observed flights to appear here; the change column compares the rate with August 2026. "Up to" is the most the law could have put on the airline. Each name opens that airline's month-by-month record; the airline delay rankings hold the newest month. The CSV carries every carrier from 20 flights.
| Carrier | Flights | Qualifying | Cancelled | Rate | vs August | Up to |
|---|---|---|---|---|---|---|
| U8 (U8) | 358 | 55 | 0 | 15.4% | new | €3.0M |
| BZ (BZ) | 822 | 83 | 1 | 10.1% | new | €4.6M |
| IZ (IZ) | 896 | 55 | 3 | 6.1% | −9.2 pts | €4.1M |
| A2 (A2) | 523 | 28 | 20 | 5.3% | new | €1.4M |
| GA (GA) | 1,346 | 53 | 46 | 3.9% | +3.2 pts | €3.7M |
| MF (MF) | 914 | 35 | 34 | 3.8% | +2.3 pts | €1.6M |
| LL (LL) | 6,976 | 252 | 173 | 3.6% | −0.4 pts | €11.4M |
| NT (NT) | 1,140 | 41 | 39 | 3.6% | +3.6 pts | €2.0M |
| Malaysia Airlines (MH) | 1,971 | 65 | 62 | 3.3% | +0.7 pts | €4.8M |
| AR (AR) | 2,094 | 68 | 56 | 3.3% | +3.3 pts | €3.5M |
| Loganair (LM) | 1,353 | 42 | 40 | 3.1% | +3.1 pts | €1.8M |
| EC (EC) | 8,958 | 276 | 229 | 3.1% | −3.5 pts | €13.6M |
Which departure airports were most disrupted in September 2026?
The same ranking by airport of departure. A high rate at a hub can reflect one bad week of weather as easily as a bad airline, so read it beside the live radar.
| Departure airport | Flights | Qualifying | Cancelled | Rate | vs August |
|---|---|---|---|---|---|
| Catania (CTA) | 3,192 | 567 | 558 | 17.8% | new |
| Madeira (FNC) | 829 | 40 | 35 | 4.8% | +4.8 pts |
| Santiago de Compostela (SCQ) | 999 | 48 | 24 | 4.8% | +4.8 pts |
| London City (LCY) | 1,148 | 51 | 49 | 4.4% | new |
| Brussels Charleroi (CRL) | 1,417 | 49 | 45 | 3.5% | +3.5 pts |
| Barcelona El Prat (BCN) | 34,879 | 1,119 | 821 | 3.2% | −1.5 pts |
| Paphos (PFO) | 757 | 22 | 11 | 2.9% | new |
| London Heathrow (LHR) | 61,637 | 1,781 | 1,521 | 2.9% | +1.6 pts |
| Aberdeen (ABZ) | 683 | 19 | 17 | 2.8% | new |
| Aalborg (AAL) | 397 | 11 | 11 | 2.8% | new |
| Corfu (CFU) | 1,491 | 39 | 16 | 2.6% | new |
| Rome Fiumicino (FCO) | 36,103 | 931 | 740 | 2.6% | +2.0 pts |
Which countries had the most disrupted departures in September 2026?
Departures grouped by the country of the airport they left from. The panel watches some countries more closely than others, so compare rates, not totals.
| Country | Departures | Qualifying | Rate | vs August | Worst airport |
|---|---|---|---|---|---|
| Italy | 77,444 | 2,143 | 2.8% | +2.0 pts | CTA |
| United Kingdom | 118,144 | 2,823 | 2.4% | +1.1 pts | LCY |
| Netherlands | 33,761 | 759 | 2.3% | +0.2 pts | AMS |
| Israel | 4,383 | 89 | 2.0% | new | TLV |
| Cyprus | 2,688 | 54 | 2.0% | new | PFO |
| Belgium | 14,964 | 272 | 1.8% | +1.8 pts | CRL |
| Turkey | 4,782 | 83 | 1.7% | new | IST |
| Spain | 142,793 | 2,283 | 1.6% | −1.0 pts | SCQ |
| Finland | 9,102 | 138 | 1.5% | new | HEL |
| Malta | 1,990 | 30 | 1.5% | new | MLA |
| Canada | 6,364 | 95 | 1.5% | new | YYZ |
| Iceland | 1,244 | 17 | 1.4% | new | KEF |
Which routes were most disrupted in September 2026?
Routes with at least 30 observed flights, ranked by the share that reached the threshold.
| Route | Flights | Qualifying | Cancelled | Rate |
|---|---|---|---|---|
| CTA – ORY | 37 | 16 | 16 | 43.2% |
| MAN – BJV | 31 | 9 | 9 | 29.0% |
| GVA – DOH | 32 | 9 | 8 | 28.1% |
| CTA – ZRH | 47 | 13 | 13 | 27.7% |
| BCN – LHR | 322 | 77 | 74 | 23.9% |
| CTA – AMS | 30 | 7 | 7 | 23.3% |
| LHR – ABZ | 254 | 57 | 53 | 22.4% |
| CTA – MLA | 64 | 14 | 14 | 21.9% |
| CTA – MUC | 46 | 10 | 10 | 21.7% |
| BER – BSL | 43 | 9 | 9 | 20.9% |
Which days in September 2026 were worst, and what slowed the network?
The three days with the most qualifying flights. Beside each are the airports where EUROCONTROL recorded the most air traffic flow delay to arrivals that day, with the main reason it gave. That describes the network, not the cause of any one flight.
- Tuesday 8 September 2026: 2,127 of 26,381 flights reached the threshold, 1,757 of them cancelled. EUROCONTROL recorded the most arrival delay at London Stansted (STN): 7,057 minutes, mostly ATC equipment; London Gatwick (LGW): 4,745 minutes, mostly ATC equipment; Tel Aviv Ben Gurion (TLV): 2,625 minutes, mostly ATC capacity.
- Wednesday 9 September 2026: 1,216 of 27,491 flights reached the threshold, 937 of them cancelled. EUROCONTROL recorded the most arrival delay at London Heathrow (LHR): 7,379 minutes, mostly aerodrome capacity; Barcelona El Prat (BCN): 7,214 minutes, mostly weather; LEPA: 6,270 minutes, mostly weather.
- Tuesday 29 September 2026: 1,122 of 29,116 flights reached the threshold, 783 of them cancelled. EUROCONTROL recorded the most arrival delay at Barcelona El Prat (BCN): 20,508 minutes, mostly weather; Tel Aviv Ben Gurion (TLV): 3,585 minutes, mostly ATC capacity; LGAV: 2,660 minutes, mostly aerodrome capacity.
The causes come from the EUROCONTROL Aviation Intelligence Portal.
How much compensation could passengers have been owed in September 2026?
We price each qualifying flight under the law that applies to its route. The figure is a ceiling, not a bill, and not money left unclaimed: we do not know how much airlines paid.
- EU261 (Regulation 261/2004): 9,183 qualifying flights, up to €521.1M.
- UK261: 2,735 qualifying flights, up to €198.6M.
- Canada APPR: 266 qualifying flights, up to €40.8M.
- Israel Aviation Services Law: 89 qualifying flights, up to €6.3M.
How should you read these flight disruption statistics?
Passenger flights that departed from or arrived at a monitored airport inside a passenger-rights territory (EU/EEA, UK, Switzerland and the other European states on the panel). Cargo and private flights are excluded. The panel is a sample of the network, so every figure is a floor on what happened, never an estimate of the whole market.
A flight qualifies when its verified arrival was 180 minutes or more late, or the airline cancelled it: the thresholds at which compensation under Regulation (EC) 261/2004 and its UK, Israeli and Canadian counterparts can arise. Qualifying does not mean owed: the airline may still show extraordinary circumstances. The bands come from Regulation (EC) No 261/2004; our EU261 guide explains them in plain language.
Estimated compensation is a statutory ceiling: each qualifying flight's legal band (EU261/UK261 distance bands, Canada's APPR delay tiers, Israel's Aviation Services Law) multiplied by typical seats for the route distance, assuming every seat is occupied and eligible. It is the most the law could put on the airline for that flight, before individual eligibility. Flights whose route cannot be resolved count as qualifying but contribute no exposure. The compensation calculator prices a single flight the same way.
The rules will change. The European Parliament approved a reform of EU261 on 7 July 2026, expected to apply from the second half of 2027. Until then the current rules stand.
Why do these numbers differ from the live data page?
The live data page recomputes on every visit and includes flights the engine is still verifying. This release counts one closed calendar month, after its flights finalised. Quote the release when you need a figure that will still be true next year; use the live page for what is happening this week.
Has the September 2026 release been corrected?
Yes. We publish every correction here, with what the release said before.
- 2 November 2026. We had counted codeshare listings once per flight number, so a flight sold by several airlines counted more than once. We now count every flight once, under the airline that operates it, and recomputed the totals, rates and rankings. Before the correction the release said 12,522 qualifying of 858,793 flights (1.5%), up to €792.2M. It now says 12,273 of 765,291 (1.6%), up to €766.8M.
How can journalists cite the September 2026 release?
Quote any figure freely. Attribute it to FlightCompensations, link to https://flightcompensations.com/data/2026-09, and name the month. A citation can read: "FlightCompensations, Flight disruption statistics, September 2026, https://flightcompensations.com/data/2026-09".
- Data: CSV for a spreadsheet, JSON for code, Markdown for text.
- Charts: SVG files you may republish with their source line, the daily chart and the airline chart.
- Spokesperson: Jaacov Sonenblick, available for comment.
- Press contact: support@flightcompensations.com. We also run cuts we do not publish, such as one route over a year.
If your own flight was among the disrupted ones, the flight check reads that one record instead of the aggregate.
Other months
Questions about the September 2026 release
Where does the September 2026 flight disruption data come from?
From our own monitoring of scheduled and actual flight times at 160 airports, not from a regulator's release. We record what happened to every passenger flight through the panel and count the ones that reached a compensation threshold. The panel is a sample, so the totals are a floor on the month, never a market estimate.
Will the September 2026 figures change later?
Only by a published correction. The month was aggregated after it closed and its flights had finalised, and the result was written once. If we find an error in how we counted, we re-issue the month and list the change, with the old figures, on the release itself.
Can I quote these statistics in an article or a report?
Yes, free of charge. Name FlightCompensations as the source, link to this release, and state the month beside the figure. For a cut we do not publish, such as one route or one airline over several months, write to support@flightcompensations.com and we will run it from the same records.
Sources
- Regulation (EC) No 261/2004 — the regulation itself, in every EU language
- EUROCONTROL Aviation Intelligence Portal, airport arrival ATFM delay data — arrival delay by airport and day, with the regulation reason